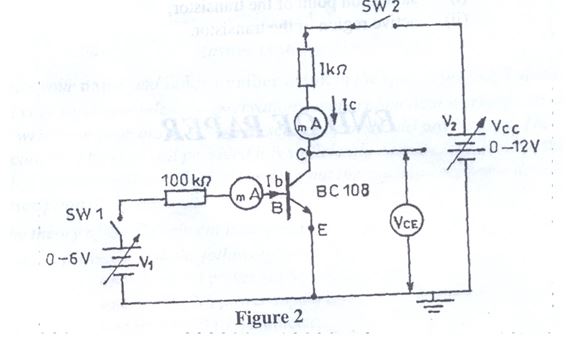
The candidates were expected to connect the circuit as shown, measure and record the Ic (mA) in Table 2 , plot a graph and make some deductions of the saturation point and active region of the transistor from the graph.
The expected answers were:
(c)
cc |
1 |
2 |
4 |
6 |
8 |
Ic (mA) |
0.5 |
0.6 |
0.8 |
0.9 |
0.9 |
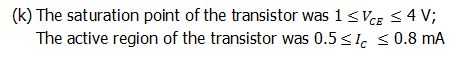
As reported by the Chief Examiner, the readings obtained by many of the candidates that answered this question showed that they did not know how to answer the question showing the active and saturation regions as depicted in the graph.