Economics Paper 2, WASSCE (SC), 2020

Question 1


The table below shows the number of workers engaged by an agricultural firm over a period of time. Study it and answer the questions that follow.


Number of workers


Total Product


Marginal Product


Average Product


0
1
2
3
4
5
6


0
20
50
70
80
80
X


0
20
30
20
Y
0
-9.8


0
20
Z
23.3
20
16
11.7


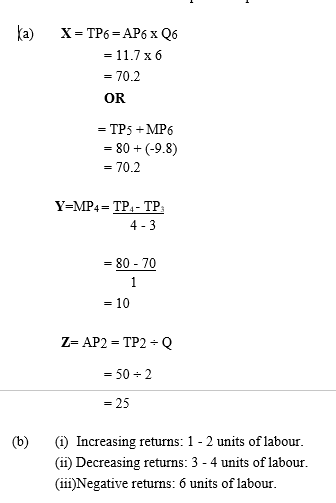
(a) Calculate the values of X, Y and Z.
(b At what level of employment of labour does the firm experience:

(i) increasing returns;

(ii)decreasing returns;

(iii) negative returns?

(c) State the law of diminishing returns.
(d) (i) On a graph sheet, draw the total product and marginal product curves.
(ii) State any two relationships between the two curves in (d)(i) above.

  Observation


This is one of the data response questions and it was attempted by majority of the candidates. The question required the candidates to calculate the values of X, Y and Z in the (a) part, determine the level of employment of labour at which the firm experiences increasing, decreasing and negative returns in the (b) part, state the law of diminishing returns, draw the total product and marginal product curves and state any two relationships between the previously mentioned curves in the (c) and (d) parts of the question respectively. Most candidates who attempted this question were able to calculate the values of X, Y and Z in the (a) part, but were unable to give the full range of the level of employment of labour at which the firm experiences increasing and decreasing returns in the (b) part. Many of the candidates stated the law of diminishing returns correctly in the (c) part, but were unable to draw a well labelled graph and state the relationships between the total product and marginal product based on the curves drawn in the (d) part, hence they could not obtain the maximum mark.
The candidates were expected to provide the following answers to score higher marks.


(c)  The law of diminishing returns states that as more and more units of a variable factor are combined with a fixed input, the marginal product increases and after a certain point begins to decline.


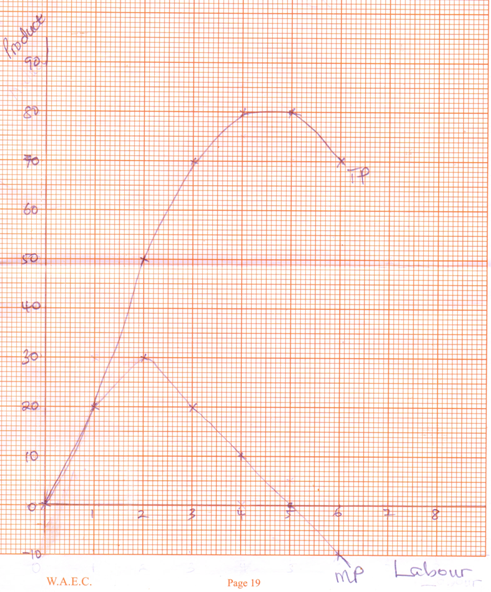
(ii) From the graph, as the variable input labour increases, both TP and MP increase, i.e. up to 2 units of labour. At 3 units of labour, TP still increases, but MP attains a maximum of 30 and begins to fall. As MP falls up to 5 units of labour, TP has reached its maximum at 80. When MP turns negative, TP begins to fall to 70.2.