Question 4
(a) What type of variation is tongue rolling? [1 mark]
(b) Give two other examples each of the type of variation stated in 4 (a) which occur in:
(i) plants;
(ii) animals. [4 marks]
(c) The heights of twenty-two students in a school are measured in cm. The results were recorded as shown below:
150 127 123 131 101 122 132 117 132 134 101
124 115 105 143 114 104 150 100 146 153 140
- Complete the frequency table below.
Height (cm) |
Frequency |
100-109 |
|
110-119 |
|
120-129 |
|
130-139 |
|
140-149 |
|
150-159 |
|
[5 marks]
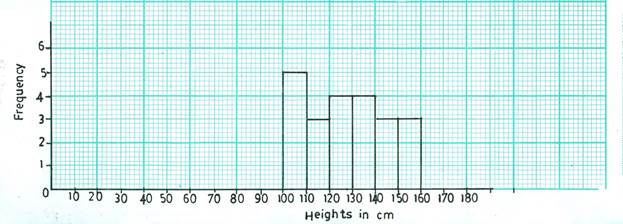
(ii) On the graph sheet provided, draw a histogram of the frequency distribution using a scale of 1cm to 10 units on the x-axis and 1cm to 1 unit on the y-axis. [10 marks]
Some candidates could state the type of variation that tongue-rolling is, although some could not spell the term properly.
Some candidates stated examples of morphological variation for plants and animals since they had missed the naming of the type tongue rolling is;
Some candidates were able to complete the frequency table and draw the histogram perfectly but some candidates could not use the specified scale.
The expected answers are:
(a) Types of variation
Physiological/discontinuous.
(b) Other examples
(i) in plants
- taste of fruits;
- resistance to diseases;
- resistance to pests;
- food contents of fruits;
- shape of seeds/fruits;
- colour of flowers;
- position of flowers/fruits.
(ii) in animals
- behaviour pattern;
- ability to taste PTC;
- hand clasping;
- ear lobe;
- blood group;
- genotype;
- fingerprint;
- Rhesus factor;
- sex
(c) (i) Frequency table
Height (cm) |
Frequency |
100-109 |
5 |
110-119 |
3 |
120-129 |
4 |
130-139 |
4 |
140-149 |
3 |
150-159 |
3 |
Any 5 x 1 [5 marks]
(ii) Histogram

Title (Tl)
A histogram showing the frequency distribution of heights
Details (D)
Same width for size of bar (Sb)
No space between bars (Ns)
Quality (Q)
Scale (Sc):
1cm to 10 units on the x-axis
1cm to 1 unit on the y-axis
Accuracy of histogram bars (Ahb)
Label of axes (La)
